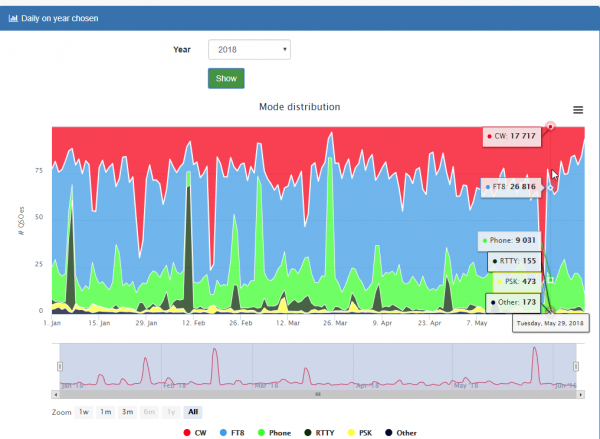
Mode statistics with data from Clublog
Posted: June 18th, 2018 under Hamradio.
 Back in late May of 2018, I noticed an email on the Club Log mailing list from Michael G7VJR, the author of Clublog. He wrote about the interest in the growth of the FT8 mode, and if other modes are losing out to it. He made the raw data available to anyone who wants to make anything out ot it. As I’ve played around a lot with databases, statistics and graphs, I thought, why not try to make something out of it. I made a page with graphs that present the data in different forms. As the possibilities with data like this are endless, I chose to make available yearly, monthly and daily graphs within the year specified. The data starts at January 1st 1990, and the raw data is usually updated from Club Log around the 10th of each month.
As for my own use of FT8, I’ve played with it since the first beta was out last year. I was running a few openings to North America on 6M last year, and I noticed that the openings were too short for JT65. That’s one of the reasons why FT8 was developed, and I also worked K1JT himself on 6M in July last year. The most interesting aspect with using a mode like FT8, is the opportunity to look at a map and see where I’ve been heard, and what I have heard. I use pskreporter all the time for this. I often leave my radio on when I am not in front of the radio, and then check the map later on to see how the propagation has been.
The problem with FT8, in my experience, seems to be that “everyone” are using it. If you listen on the FT8 frequencies, you hear a lot of activity. If you check the CW or SSB portion of the band, you either hear nothing, or very little. I don’t know if this is a period that will pass, but for the time being, FT8 is very popular. I use it, but at the same time, I found it a bit boring and unpersonal when it comes to making contacts on the radio.
Ok, enough with that, take a look at the statistics here.
Comments: No comment yet, you could be the first
